Watchdog Stack Overview
In hard real-time systems, such as automotive ECU's, a watchdog is critical to monitor its behavior. Learn about the watchdog stack here
Ensuring the timings and logical execution of all entities are respected is crucial to ensure the software inside the ECU is running correctly and consistently throughout a long operating cycle. The watchdog is transversal to embedded environments. Since it's already on hardware, it's a great option for monitoring the ECU behavior.
In this regard, Autosar contains an entire Watchdog stack to make the configuration easier for you. It consists of 3 modules, which we'll use as the starting point to show you how one can use the Watchdog in the Autosar architecture. So, without further ado, let's look at the modules involved:
Modules involved in the Autosar watchdog stack
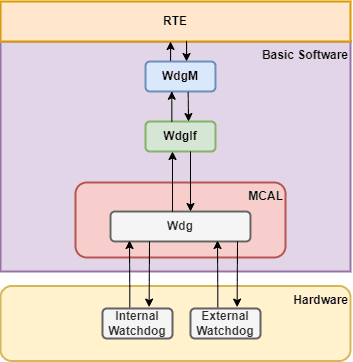
In the following picture, starting from the bottom you see:
Wdg (Watchdog Driver) - Abstracts the watchdog hardware. Allows you to configure multiple (including external, which will depend on other drivers, such as SPI or DIO) watch dogs, using identical API's in the upper layers, without having to care about where in hardware it is located. Three modes for the watchdog are defined and you can control which one to use at a given time in this layer:
(insert table on wdg driver for the modes)
-
WdgIf (Watchdog Interface) - Apart from holding the lower and upper layers together, this module does not do much. In case you are using multiple watchdogs (one internal and one external, for example), it allows the upper layer to select the desired one.
-
WdgM (Watchdog Manager) - This is where most of the magic happens. By resorting to the underlying watchdog interface, you are allowed to configure Supervised Entities (SE), which are then connected via code to the specific part of your Software you want to monitor.
Every monitoring point is defined as a checkpoint. Whenever you want to report to the watchdog, you are notifying the watchdog manager the reach of a checkpoint, either through API's or ports. Depending om the monitoring scheme you select, you will be required to configure a certain amount of checkpoints.
Three different monitoring options are available, depending on the use case and the type of monitoring you want to perform:
| Supervision Type | Description |
|---|---|
| Alive Indication | Used for cyclic SE's, to check if the supervised entity is executed the correct number of times in a specific time slice. In this scheme, you will need to create one checkpoint |
| Deadline Monitoring | Used in non-cyclic SE's, to monitor if your asynchronous entity takes the expected amount of time executing. In this case, you will need to create two checkpoints. One for your starting point and another for your ending point. Then, the execution timespan is measured and if the dealines defined are passed, the watchdog manager reports a monitoring error |
| Logical Supervision | This one is more related to functional safety (ou can learn the basics of functional safety in our article What is Functional Safety (opens in a new tab)). It ensures your SE is executed in the correct order. In this case, the number of checkpoints is arbitrary, as it depends heavily on your use case. This group of checkpooints will create a graph in the end, where you can analyse if the order of the checkpoints is the one expected, of if there was a problem |
One thing left out of the image is the connection with other Autosar modules. Probably, the most important is the DEM (Diagnostic Event Manager), the responsible to report problems within your ECU (you can learn more about the DEM here, in our article DEM Overview (opens in a new tab)). The watchdog is no exception, as you will want to report the existence of monitoring failures to it.
Laslty, you see a connection to the RTE there. That's because your supervised entities can be in the application layer, and you may also want to report a supervision failure to the application layer, to, for instance, enable a fault reaction mechanism. Aside from this, your SE's might be in the application layer, so you'll need service ports to report checkpoints.
As some finishing notes, I hope this article helped you better understand the watchdog stack on an overview level. Make sure to tune in for future articles, as we'll certainly return to it, at least with some practical examples.
Author: Micael Coutinho (opens in a new tab)
References:
- Specification of Watchdog Driver - Autosar Specification (opens in a new tab)
- Specification of Watchdog Interface - Autosar Specification (opens in a new tab)
- Specification of Watchdog Manager - Autosar Specification (opens in a new tab)
More from the author
© AutosarToday —@LinkedIn